Printing the Humber Estuary
/
Some time back we got an email from Chris in the Geography Department. He had some data that he wanted to visualise in 3D. Warren and I thought it might be fun to have a go and so Chris sent through a file and I wrote a little Python program that converts it from the DEM format that Geographers like to the STL format that Cura and Una like. Above you can see the results being displayed in FreeCad.
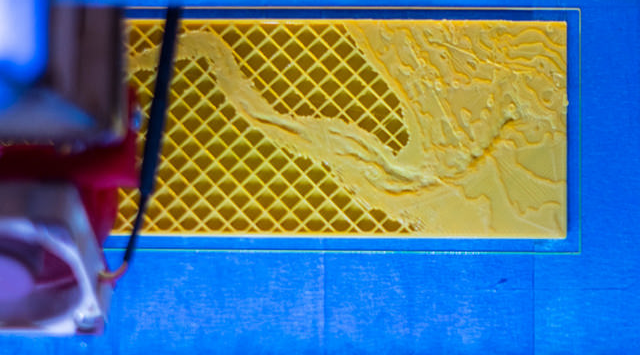
This is the surface being printed. You can see that the bits close to sea level have been filled in and the higher regions are being "shaded" with mostly empty space. The printer will put those bits on later. The groove is the path that the river has cut into the seabed.

This is the finished result. If you look carefully you can spot the Spurn Point at the end of the land. The height has been massively scaled up, along the top you can see some hills, this is about where the Humber Bridge goes.
Chris wants to use the models to help people visualise what happens when an area is flooded. The next thing to do is try to produce some models with different colours for the areas above and below sea level.